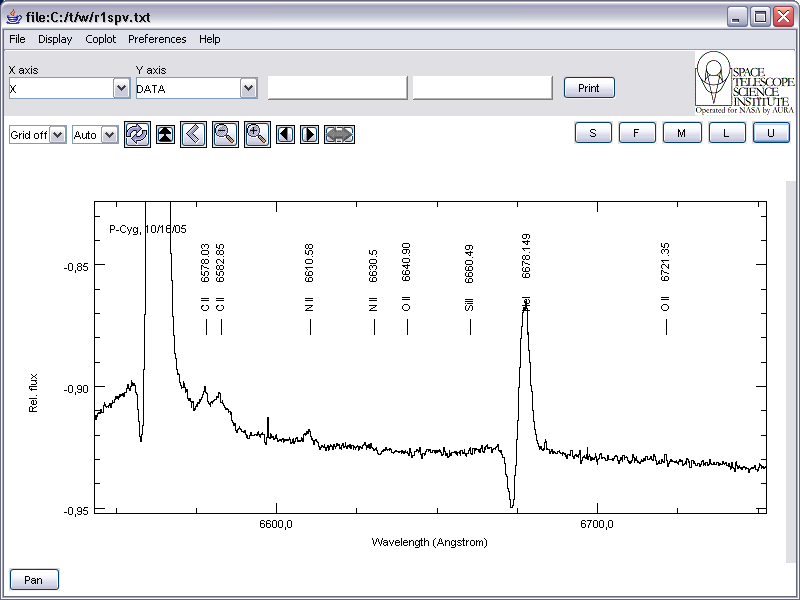
Fig.1: P Cyg-spectrum, 09/21/2005. In this narrow wavelength range of 200A, two prominent lines of H-alpha and HeI show the characteristic profiles, resulting from an overlay of an emission componet originating from a strong stellar wind and a blue shifted absorption component. While a significant fraction of photons which leave the star in any direction are scattered to form the emission feature, the absorption is due to photons scattered by this wind also. They originally left the star exactly pointing to the observers position and are lost by scattering out of the line of sight.
When I tried to calibrate this spectrum for wavelength, I had no significant feature of known wavelength as fixpoint, because one can not rely on the P cyg profiles here and the other features are rather poor.
Comparing the H-alpha absorption and the one in He I (6678A), the last seems to be stronger. This might by due to the fact, that they originate in different layers (different physical regimes) of the stellar atmosphere.
To clarify the situation I have made a small animation, showing the overlay of the absorption and emission components for variing Doppler shifts.
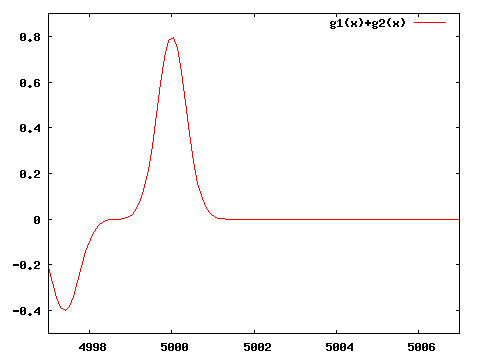
Fig.2: Emission fixed, absorption moves from blue to red. Both lines are simply overlayed Gaussians.
We recognize that the appearance which comes close to the H-alpha profile, results from a not so strong blue shift of the absorption as it is obvious for the HeI line. While the amplitude of H-alpha emission seems to be reduced significantly, this is not true for the HeI line. These phenomena are not so pronounced in other wavelength domains as can be seen in figure 3.
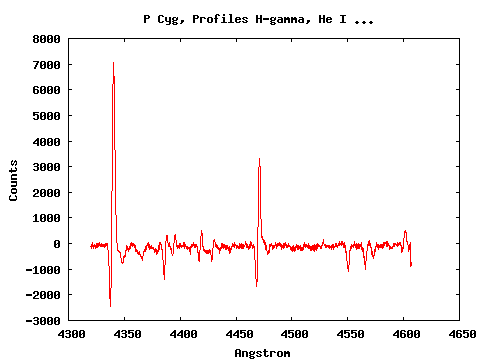
Fig.3: 10/16/2006. Spectrum of P Cyg in the blue.
Comments welcome, contact:
![]()