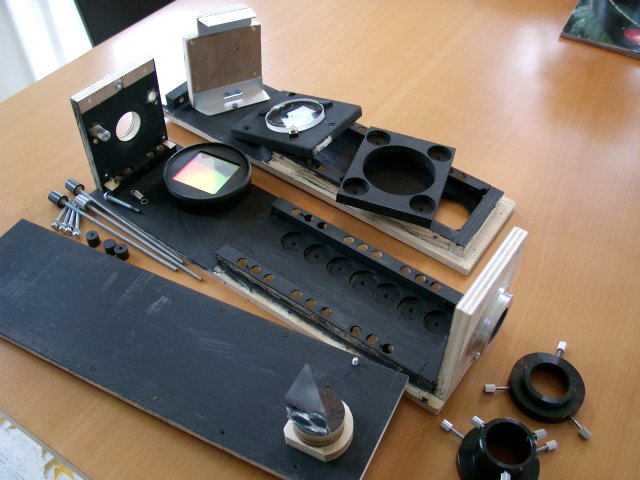
To view spectral details in higher resolution I built a LIttrow SPectrograph (LISP1). Technical details: grating of 50x50mm size, 1200 lines/mm, blazed at 2800Å, an achromatic objective 330mm f/5, that serves as collimator and imaging lens (Littrow design). When a slit (broad or narrow) is used, this lens must be focused on the slit and the CCD at the same time. In the slitless mode, spectra are focused on the CCD by the telescope focuser. The position angle of the grating can be adjusted with help of a screw such that the desired spectral window can be recorded by the CCD. A detailed technical specification can be found here.
Fig.5: Ingredients of LISP1. Different adaptors can be used to attach all sorts of cameras or oculars.
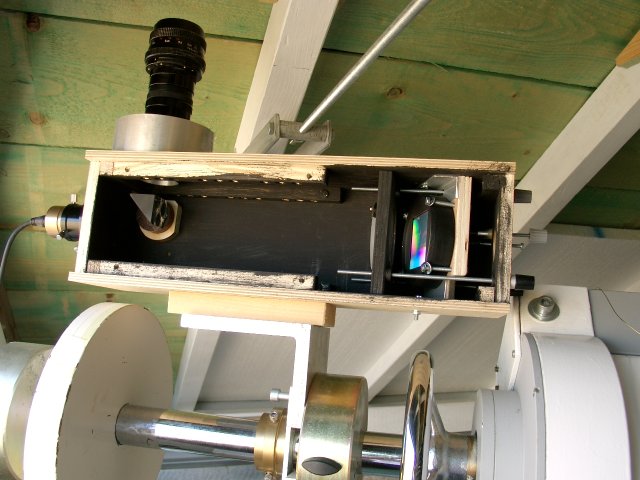
Fig.6: First tests with video camera and 50mm f/2 objective.
Spectrograph is mounted on declination axis of telescope. The attachment
to the telescope was changed to achieve more flexibility as can be seen in Fig.8.
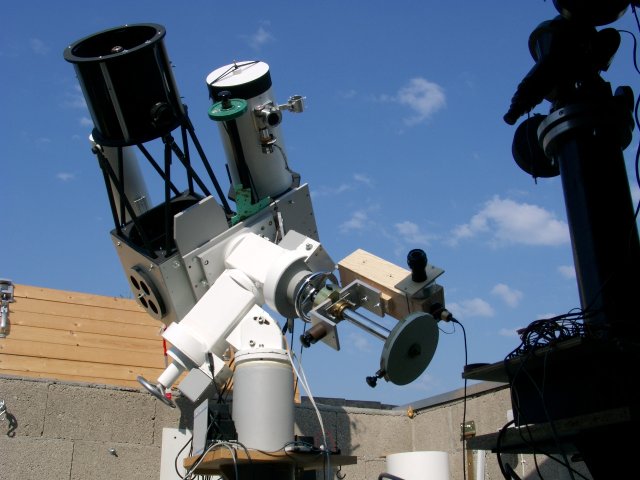
Fig.7: Waiting for the Sun.
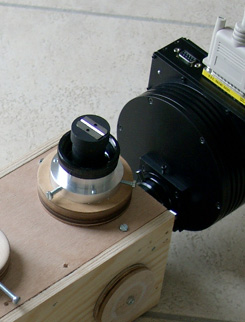
Fig.8: Here one of the slits is shown. It is made of pencil sharpener blades. Best focus is achieved with help of a small finder scope, when the grating is not build in. The scope pears through the 30mm hole, visible on the left in Fig. 10. Slit and CCD must be in sharp focus at the same time. Adjustments are made with screws visible in Fig. 6.
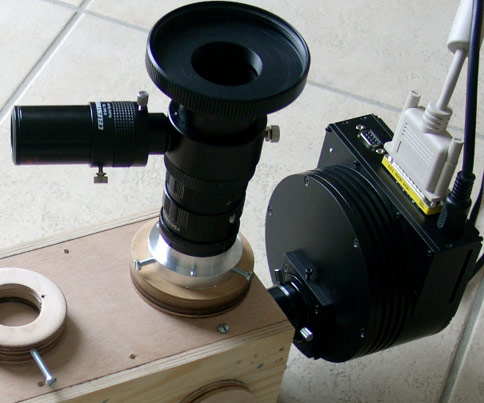
Fig.9: Ready to be attached to my C11.
Original Celestron
Radial Guider is used to verify the object is close to the slit
or might be
used for long guided exposures. The ring is used to achieve a
more rigid connection
to the telescope.

Fig.10: Here a small telescope (mirror-lens) 500mm f/8 is used.
Common T2-connectors and M42 extension tubes allow flexible interchange of optics.
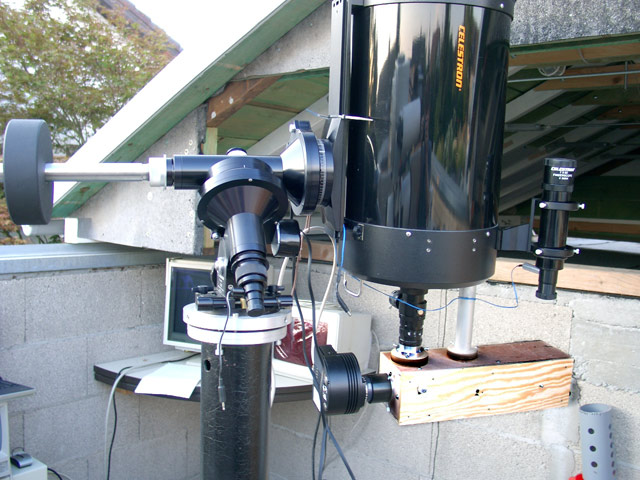
Fig.11: Spectrograph and CCD camera attached to telescope for the first time (8/02/2005).
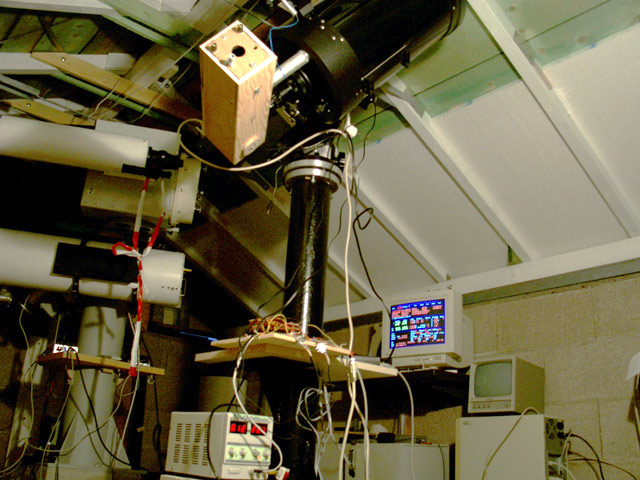
Fig.12: Original electronic drive system on CG11 is replaced
by a computer controlled
"Mel-Bartels-system". LX200 compatibility
allows now scripted control of the whole
equipment with help of a second computer
from the warm room below.

Fig.13: Spectrum of an fluorescent energy saving bulb. Might be useful for calibration?

Click to see it full resolution
Fig.14: Spectrum of Neon. Brightest line is 5852.5Å.
![]()
Fig.15: Deep at the end of the visible red part. Atmospheric O2-telluric absorption lines around 6820 Å.
![]()
![]()
Fig.:16: Mosaic of solar spectrum in the visible range (Click
to see it in full resolution).
Technical details: No Telescope in front
of slit
(wide slit), camera ST-8e, exp.time 1.8s, binning 2x6.
First-Light was 08/30/2005. I was astonished how easy it was to obtain spectra of brighter stars. Exposure times of a few seconds were enough to obtain a good signal / noise ratio.
|
|
|
|
|
|
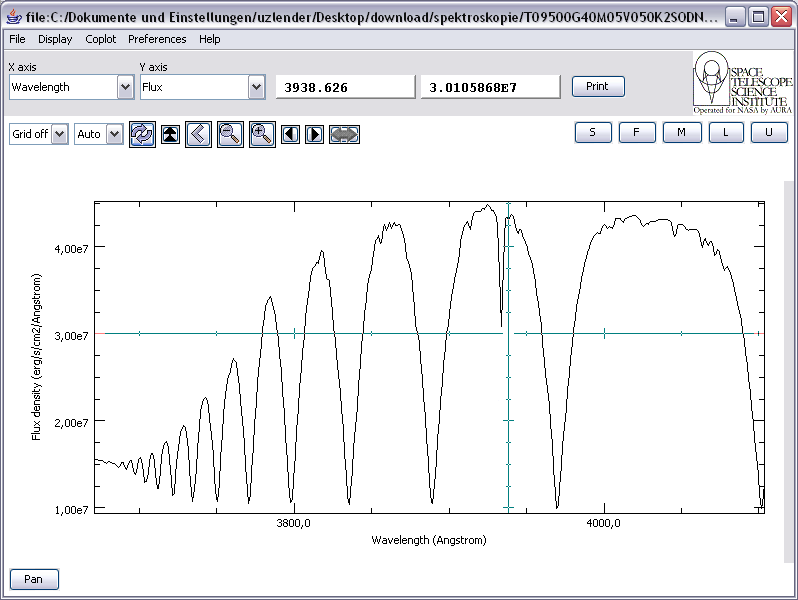
(Specview
is a product of the Space Telescope Science Institute,
which is operated by AURA for NASA.) |
|
|
|
|
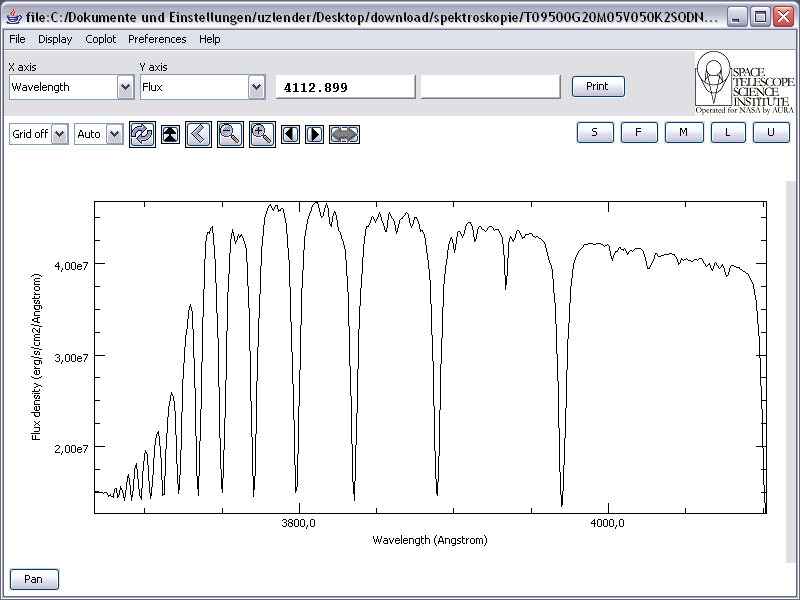
(Specview is a product of the Space Telescope Science Institute, which is operated by AURA for NASA.)
![]()
Fig.19: Vega, 20Å around the Hα-line.
Most of the other lines result from H2O in our own atmosphere.
Spectra of the following stars were recorded until now.
|
Name |
Spectraltype |
Focus on |
Instrument |
Notes |
Obs.-Date |
|
42-And |
B7Ve |
Hα |
CG11,LISP1,ST-8e |
emission lines |
|
|
β-Aql |
G8VIvar |
|
CG11,LISP1,ST-8e |
|
|
|
σ-Aql |
B3V |
|
CG11,LISP1,ST-8e |
|
|
|
γ-Cas |
B0VIe |
Hα |
CG11,LISP1,ST-8e |
emission lines |
|
|
F8Iavar |
Hα |
CG11,LISP1,ST-8e |
|
30.10.05 | |
|
57-Cyg |
B5V |
|
CG11,LISP1,ST-8e |
spectr.double* |
|
|
A2Ia |
Hδ-H9 |
CG11,LISP1,ST-8e |
|
5.9.05 | |
|
B1pe |
Hα |
CG11,LISP1,ST-8e |
emission lines |
16.10.05 | |
|
α-Lyr |
A0V |
Hα |
CG11,LISP1,ST-8e |
|
|
|
β-Lyr |
B7Ve+A8p |
Hα |
CG11,LISP1,ST-8e |
emission lines |
|
|
δ2-Lyr |
M4IIvar |
|
CG11,LISP1,ST-8e |
|
|
|
ζ2-Lyr |
A3 |
|
CG11,LISP1,ST-8e |
|
|
|
κ-Del |
G5IV |
|
CG11,LISP1,ST-8e |
|
|
|
ι-Peg |
F5V |
|
CG11,LISP1,ST-8e |
|
|
|
A2V |
Hα |
CG11,LISP1,ST-8e |
spectr.double* |
20.9.,16.10.05 |
Tabelle 1
In general:
For usage with slit:
Comments welcome, contact:
![]()